
Design Analytics Dashboard (Clickstream)
Problem Context
📊 Clickstream analytics captures every user interaction on a website or app: clicks, page views, scrolls, hovers, and more.
Functional Requirements
Clarify with your interviewer what part of the analytics you're designing and adjust to what they want to see. We'll focus on event ingestion and real-time metric visualization.
Core Functional Requirements
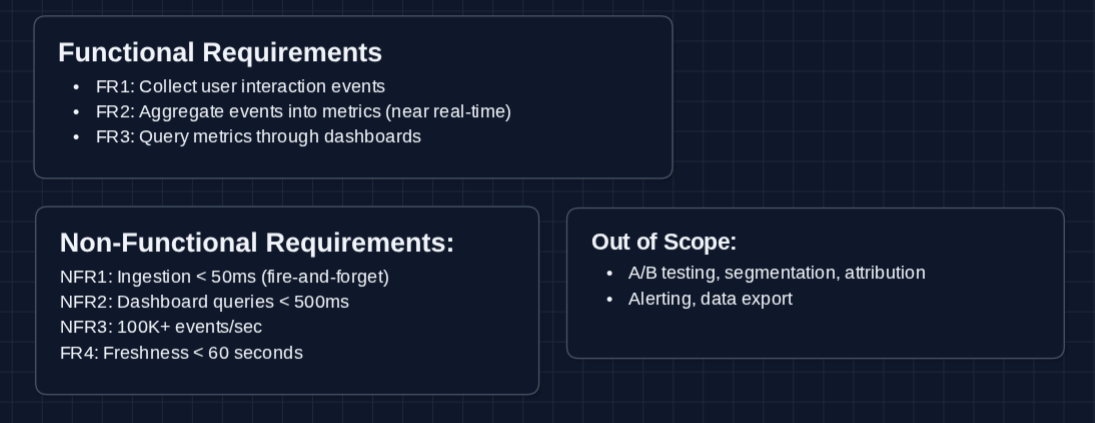
- FR1: Clients should be able to send user interaction events (clicks, page views, etc.).
- FR2: The system should aggregate events into queryable metrics in near real-time.
- FR3: Users should be able to query metrics through dashboards (ex: "page views per hour for the last 7 days").
Out of Scope:
- A/B testing infrastructure and experiment assignment.
- User segmentation and cohort analysis.
- Marketing attribution modeling.
- Data export and ETL pipelines.
- Alerting and anomaly detection.
The interesting challenge here is the firehose problem. How do you collect 100K+ events per second without blocking clients, then transform that flood into query-friendly aggregations?
Non-Functional Requirements
Core Non-Functional Requirements
- NFR1: Event ingestion should not block the client (fire-and-forget, < 50ms response).
- NFR2: Dashboard queries should return in < 500ms.
- NFR3: System should handle 100K+ events per second at peak.
- NFR4: Metrics should reflect events within 60 seconds of occurrence.
Here's what we have so far:
Let's build this!
The Set Up
The Core Challenge
Every button click, page scroll, and form submission generates an event. A popular website with 10 million daily users might generate 500 million events per day. We need to pre-aggregate events into metrics that can be queried when the user requests it.
Core Entities
These entities help us understand the data flow. In an interview, you can jot down parts of these on the whiteboard.
Event (the raw data we collect)
{
  eventId: "evt_abc123",
  eventType: "page_view",           // click, scroll, form_submit, etc.
  userId: "user_456",
  sessionId: "sess_789",
  timestamp: "2026-01-10T14:30:00.123Z",
  properties: {
    page: "/checkout",
    referrer: "/cart",
    device: "mobile",
    browser: "chrome"
  }
}
Metric (aggregated data we query)
{
  metricName: "page_views",
  dimensions: {page: "/checkout", device: "mobile"},
  timeGranularity: "hour",
  timeBucket: "2026-01-10T14:00:00Z",
  value: 15847
}
Dashboard Query (what the frontend requests)
{
  metric: "page_views",
  dimensions: ["page", "device"],
  filters: {page: "/checkout"},
  timeRange: {start: "2026-01-03", end: "2026-01-10"},
  granularity: "day"
}
API Interface
We have two main API categories: Event Collection (high-volume writes from clients) and Dashboard Queries (reads from analysts/dashboards).
For event collection, we prioritize speed over confirmation. The client should never wait for event processing to occur.
Event Collection APIs: FR1
1. Push Event (Single)
POST /api/v1/events/track

Request:
{
  "eventType": "page_view",
  "userId": "user_456",
  "sessionId": "sess_789",
  "properties": {
    "page": "/checkout",
    "referrer": "/cart"
  }
}

Response:
HTTP 202 Accepted
{
  "status": "queued"
}
Why 202 Accepted? We acknowledge receipt immediately without waiting for processing. The event goes into a queue for async handling. This keeps client latency under 50ms.
2. Push Events (Batch)
POST /api/v1/events/batch

Request:
{
  "events": [
    {"eventType": "page_view", "page": "/home", ...},
    {"eventType": "click", "element": "signup_btn", ...},
    {"eventType": "scroll", "depth": 75, ...}
  ]
}

Response:
HTTP 202 Accepted
{
  "status": "queued",
  "count": 3
}
Why batching? Mobile apps or web apps can buffer events locally and send them in batches. This reduces HTTP overhead and handles intermittent connectivity.
Dashboard Query APIs: FR3
1. Query Metrics
GET /api/v1/metrics/query?metric=page_views&dimensions=page,device&granularity=hour&start=2026-01-10T00:00:00Z&end=2026-01-10T23:59:59Z

Response:
{
  "metric": "page_views",
  "granularity": "hour",
  "data": [
    {
      "timeBucket": "2026-01-10T14:00:00Z",
      "dimensions": {"page": "/checkout", "device": "mobile"},
      "value": 15847
    },
    {
      "timeBucket": "2026-01-10T14:00:00Z",
      "dimensions": {"page": "/checkout", "device": "desktop"},
      "value": 23102
    },
    // ... more rows
  ]
}
What happens behind the scenes?
- Parse the query parameters
- Query the database for pre-aggregated metrics
- Return results (we'll see how this is optimized in the HLD)
2. Get Available Metrics
GET /api/v1/metrics

Response:
{
  "metrics": [
    {"name": "page_views", "dimensions": ["page", "device", "browser"]},
    {"name": "unique_visitors", "dimensions": ["page", "country"]},
    {"name": "session_duration", "dimensions": ["landing_page"]}
  ]
}
High-Level Design
We'll start with the simplest approach and fix problems as we hit them. Our goal is to satisfy FR1 (collect events), FR2 (aggregate), and FR3 (query).
Focus on functional requirements first, addressing non-functional ones when they'd break the design. Deep dives let you zoom in and refine specific areas.
1) The Simplest System: FR1, FR3
When a client sends an event, just write it to the database. When a dashboard queries, scan the events:
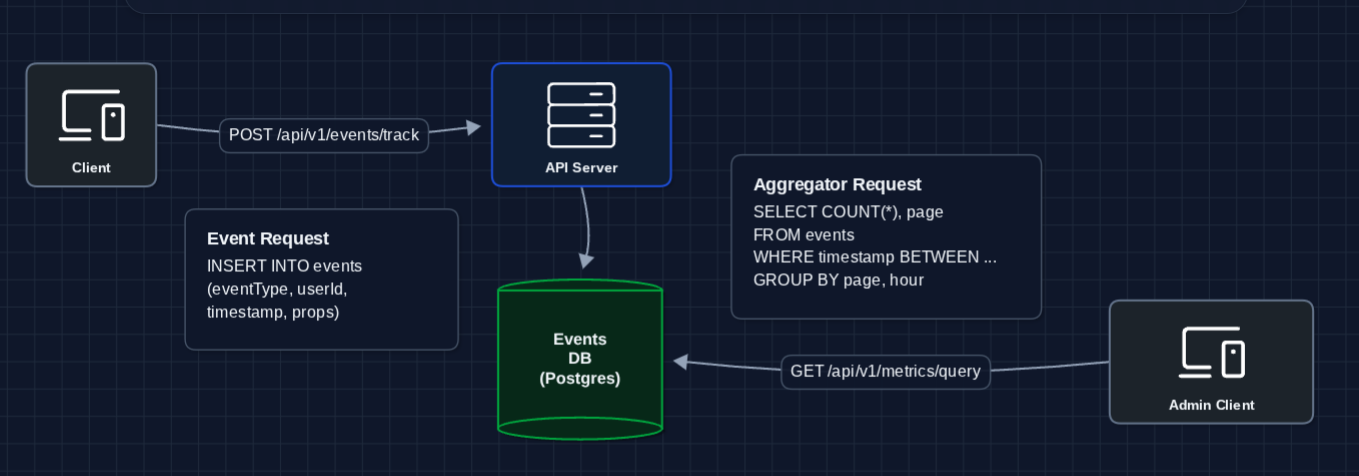
Events go in and queries aggregate quickly.
Why does this break immediately?
- Write latency: INSERT is synchronous. The client waits for the DB write to complete.
- Query latency: Aggregating 500M events per day means scanning terabytes for each dashboard query.
- Write throughput: A single Postgres instance can't handle 100K inserts/second.
We need to decouple writes from processing.
2) Decouple Writes with a Message Queue: FR1 (Event Collection)
The first problem is that clients wait for DB writes. Let's buffer events in a queue:
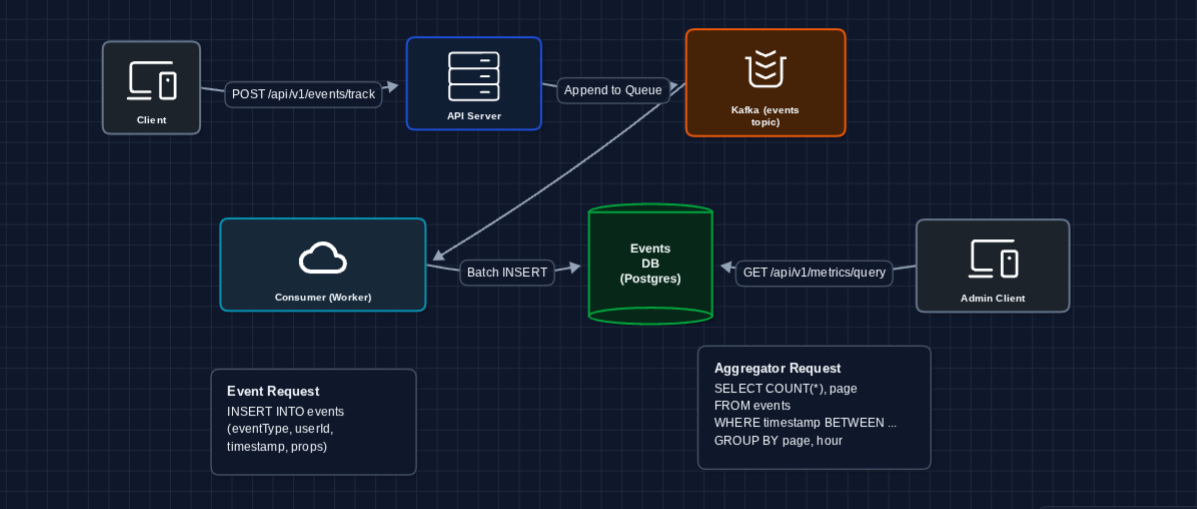
The client gets a response in milliseconds. Kafka buffers events, and workers process them in batches asynchronously.
What we fixed:
- Write latency: API just appends to Kafka (extremely fast)
- Reliability: Kafka persists events even if workers are temporarily down
- Throughput: Kafka handles 100K+ messages/second easily
What still breaks?
- Query latency: We're still scanning raw events for every dashboard query
- Storage: Raw events grow unbounded
We need to pre-aggregate.
3) Add Stream Processing for Aggregation: FR2 (Metrics)
Instead of aggregating at query time, let's aggregate as events arrive. A stream processor continuously computes running totals:
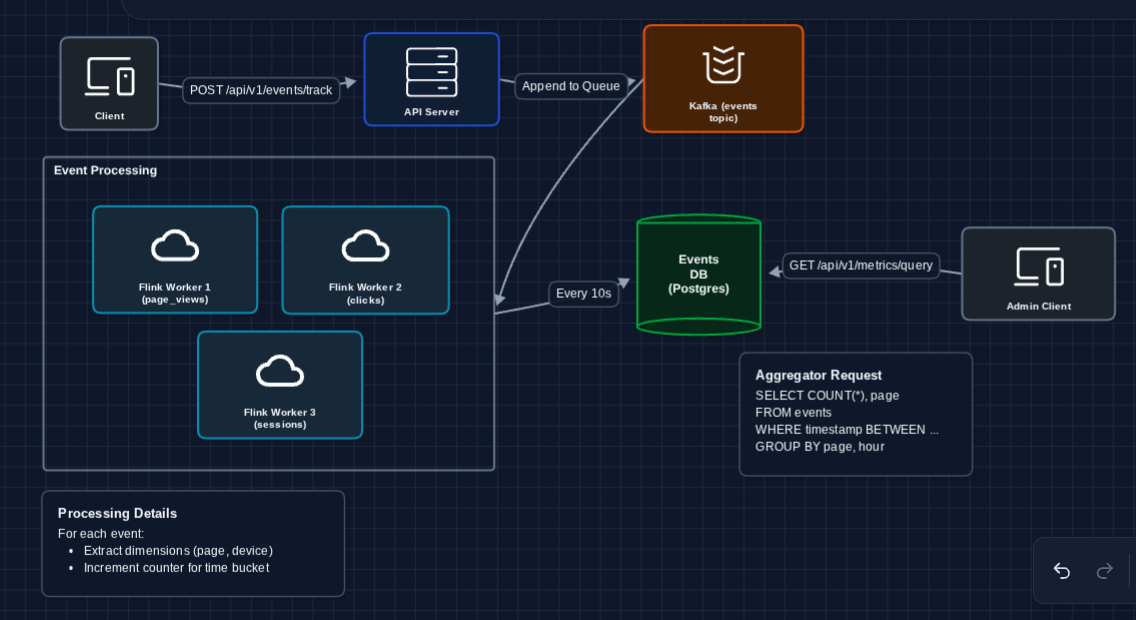
What's happening in Flink?
For each incoming event, the stream processor:
- Tumbling window: Groups events into 1-minute time buckets
- Key by dimensions: Groups by (page, device, browser)
- Count: Increments the running total for that bucket
Every 10 seconds, it flushes the current window's aggregates to the Metrics DB.
What we fixed:
- Query speed: Dashboard queries hit pre-aggregated data, not raw events
- Storage efficiency: Aggregates are orders of magnitude smaller than raw events
What still breaks?
- Query latency: Even aggregated data needs efficient storage for time-range queries
- Combinatorial explosion: What if we have 1M unique pages × 100 devices × 24 hours?
We need the right database for time-series data.
4) Add Time-Series Database: FR3 (Dashboard Queries)
Aggregated metrics are time-series data (values changing over time). Generic SQL databases aren't optimized for time-range queries. Let's use a columnar time-series database:
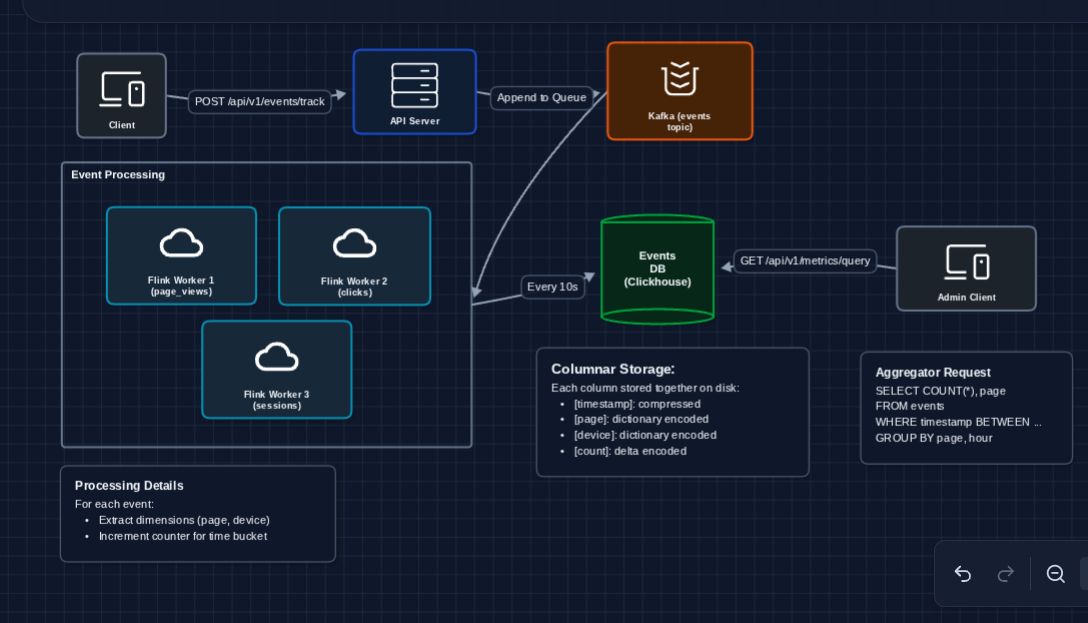
Why columnar storage?
Dashboard queries are analytical: SELECT page, SUM(count) FROM metrics WHERE timestamp BETWEEN .... They touch few columns but many rows. Columnar databases:
- Read only the columns needed (skip unused data)
- Compress similar values together (timestamps, repeated strings)
- Execute in vectorized batches (SIMD instructions)
Why ClickHouse specifically?
ClickHouse is designed for exactly this use case:
- MergeTree engine: Partitions by time, indexes by dimensions
- Compression: 10-20x compression ratios on time-series data
- Query speed: Billions of rows scanned per second per node
5) Add Browser Caching: FR3 (Complete)
Dashboard queries hit ClickHouse, but we can avoid repeated requests with simple HTTP caching:
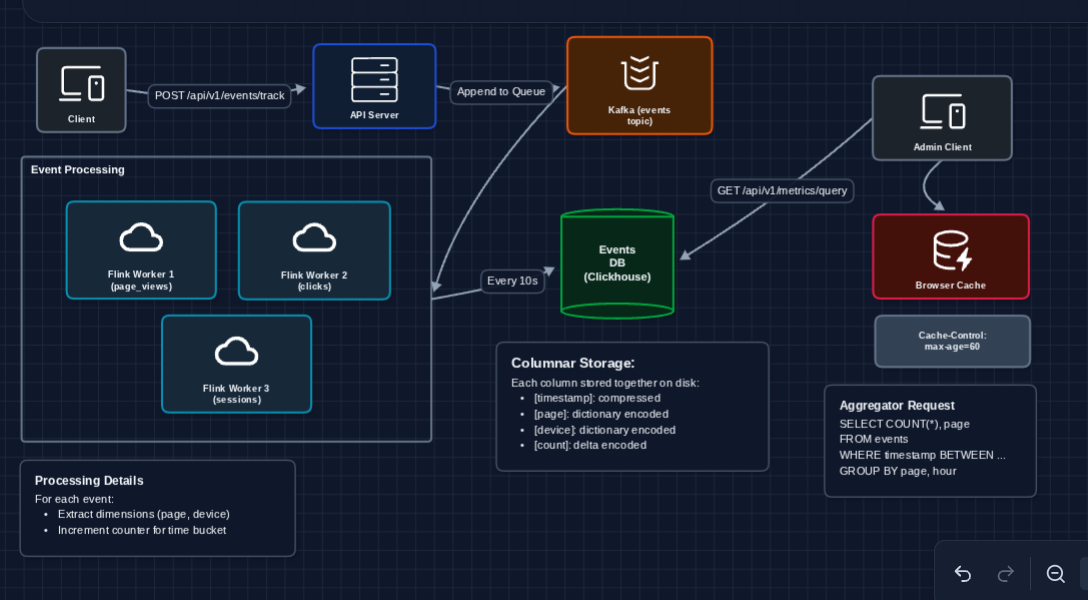
Why cache at the browser?
The simplest caching is HTTP caching. The Query Service returns responses with Cache-Control: max-age=60. The browser caches the response and won't even make a network request for 60 seconds.
- First request: ~200ms (hits ClickHouse)
- Repeated requests within 60s: instant (browser cache)
This aligns with our freshness requirement (NFR4: 60 seconds) and requires zero additional infrastructure.
Complete System
We satisfy all functional requirements:
- FR1 ✅ Collect events
- FR2 ✅ Aggregate in near real-time (Flink stream processing)
- FR3 ✅ Query through dashboards (Query Service → ClickHouse)
Now we can address non-functional requirements in the deep dives:
- NFR1 (Ingestion latency): How do we guarantee fire-and-forget?
- NFR3 (Throughput): How do we scale to 100K+ events/sec?
- NFR4 (Freshness): How do we handle late-arriving events?
- NFR2 (Query latency): How do we optimize dashboard queries?
Potential Deep Dives
1) How do we guarantee fire-and-forget ingestion?: NFR1 (Latency)
In Diagram 2, we said the API just appends to Kafka and returns immediately. But what if Kafka is slow or down?
The problem:
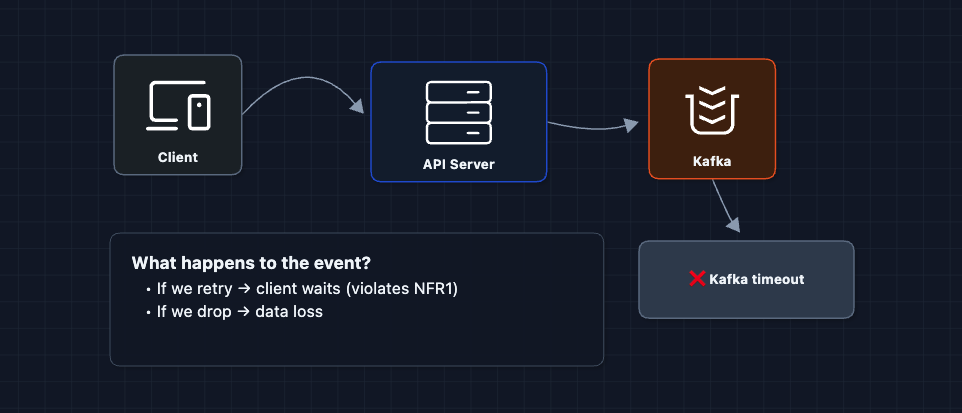
The fix: Local buffer + async retry
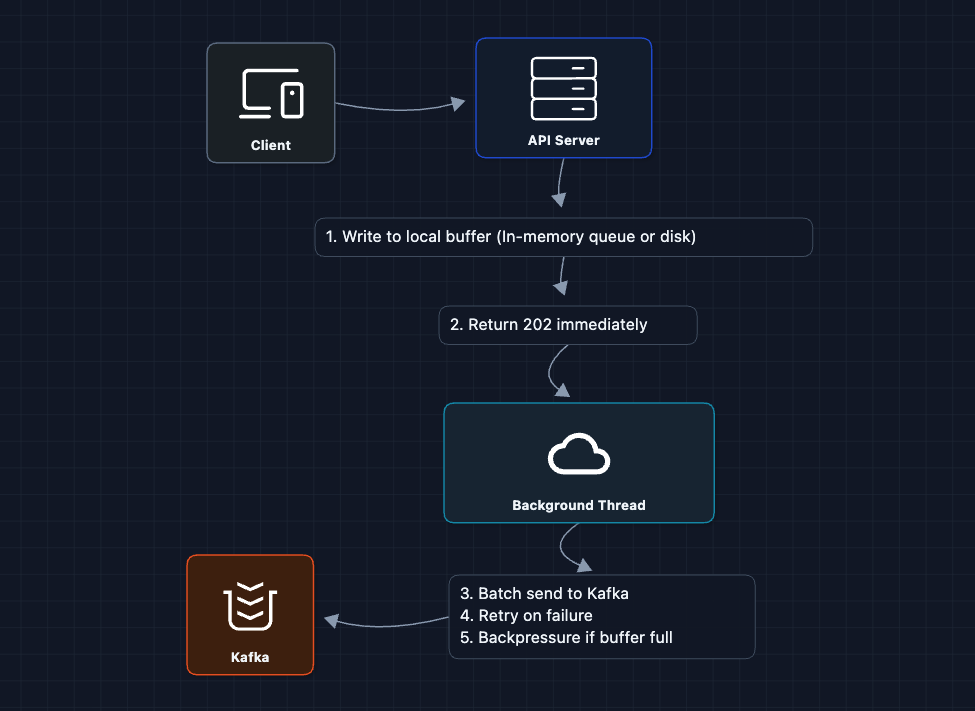
Key insights:
- Local buffer: Each API server has an in-memory ring buffer (or disk-backed queue like Chronicle Queue)
- Immediate return: Client never waits for Kafka
- Async flush: Background thread batches and sends to Kafka
- Backpressure: If buffer fills up, start dropping oldest events (acceptable for analytics)
This trades exactly-once delivery for latency. We accept that a small percentage of events might be lost during failures. For analytics, 99.9% accuracy is acceptable.
2) How do we handle late-arriving events?: NFR4 (Freshness)
Events can arrive after their aggregation window closes (mobile offline, network delays). Flink uses watermarks to handle this:
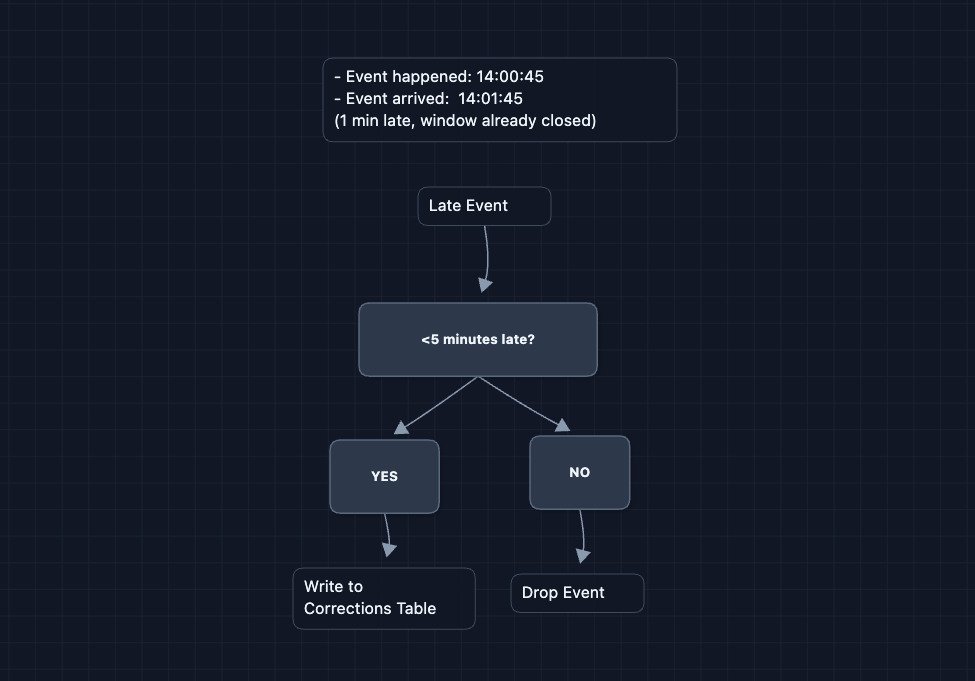
Late events go to a separate corrections table instead of the main aggregates. When the dashboard queries, it adds both: on-time count (5000) + late corrections (+42) = accurate total (5042).
3) How do we scale to 100K+ events/sec?: NFR3 (Throughput)
In Diagram 6, we have one Kafka topic and one Flink cluster. What happens at 100K events/second?
Scaling the ingestion pipeline:
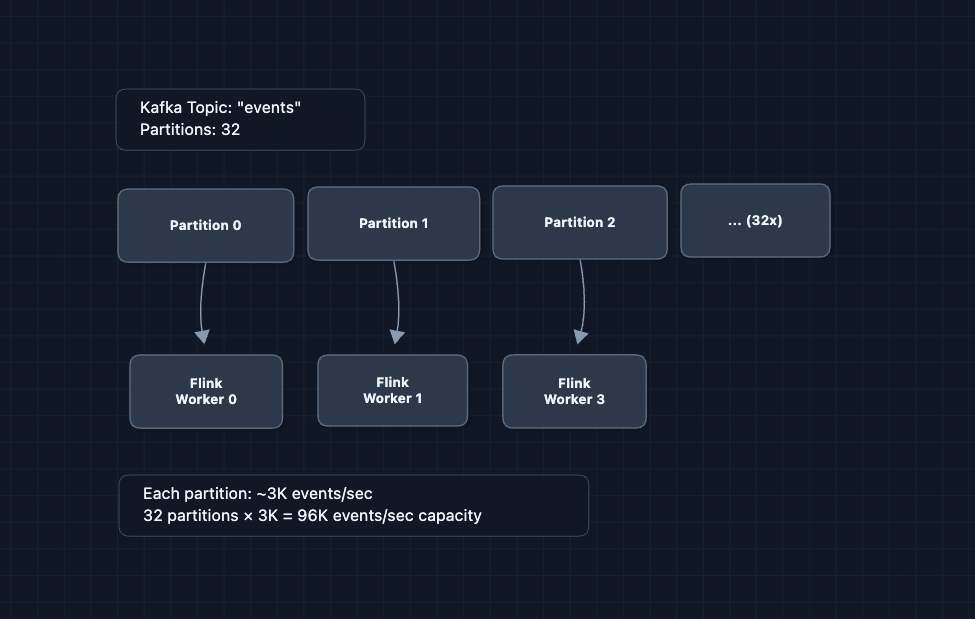
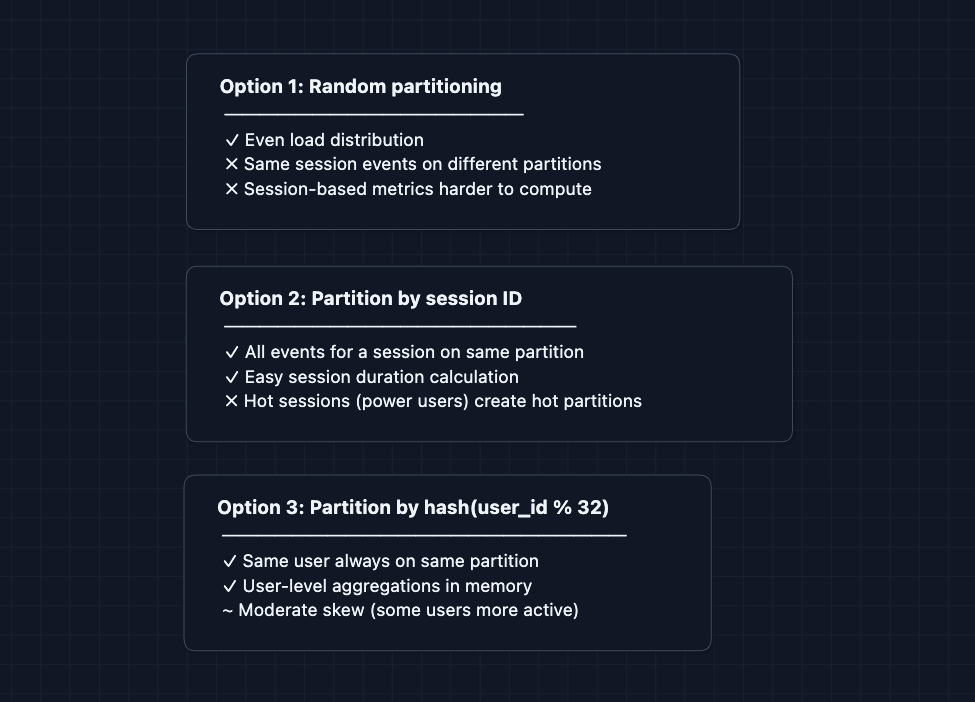
Partition key matters:
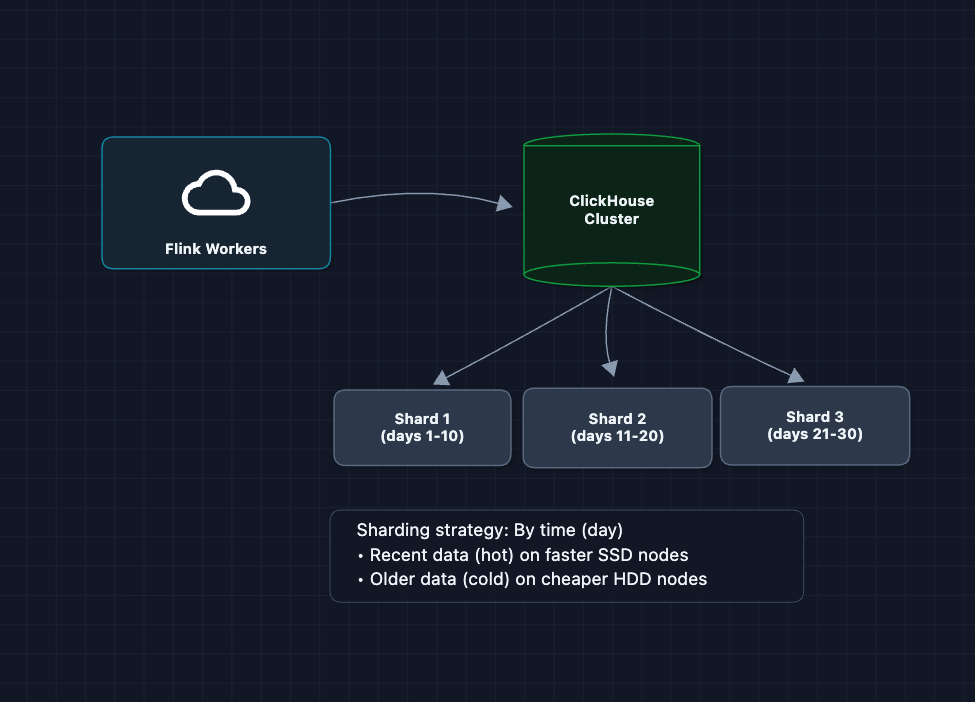
Scaling ClickHouse writes:
4) How do we optimize dashboard query performance?: NFR2 (Query Latency)
When Flink aggregates events, it groups by dimensions like page, device, and country. The problem: every unique combination becomes a row.
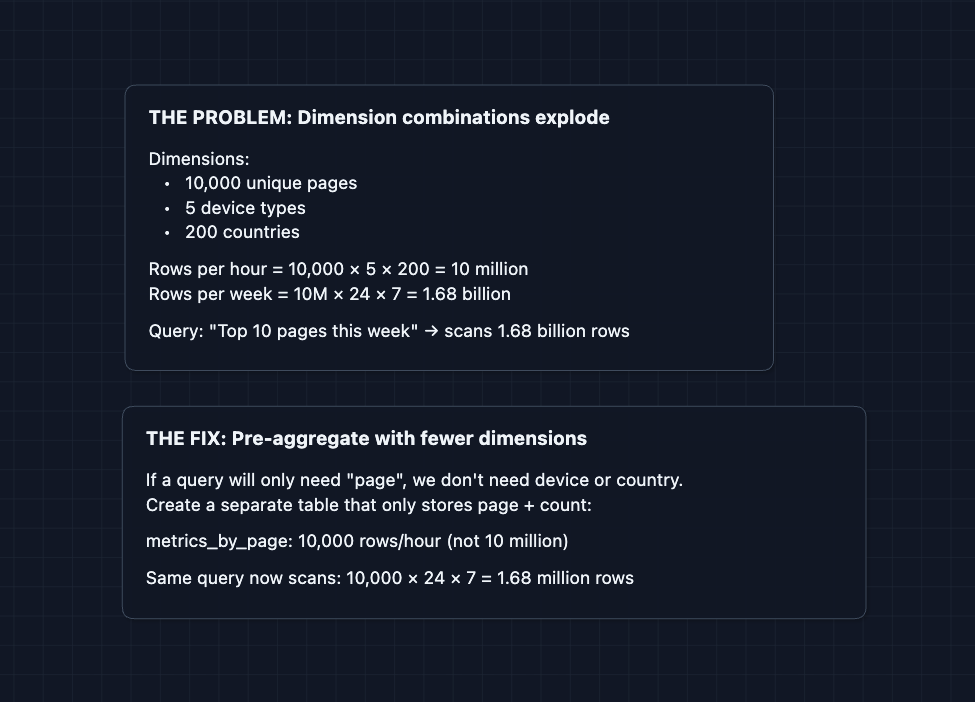
The Query Service picks the smallest table that has the dimensions the query needs.
5) How do we handle schema evolution?: Long-term Maintainability
Events change over time. In January you track page, in March you add loadTimeMs, in June you rename page to pageUrl. If Flink expects one schema but gets another, it crashes.
The fix: a schema registry stores every schema version. Each event includes a schema ID, so Flink knows exactly how to deserialize it.
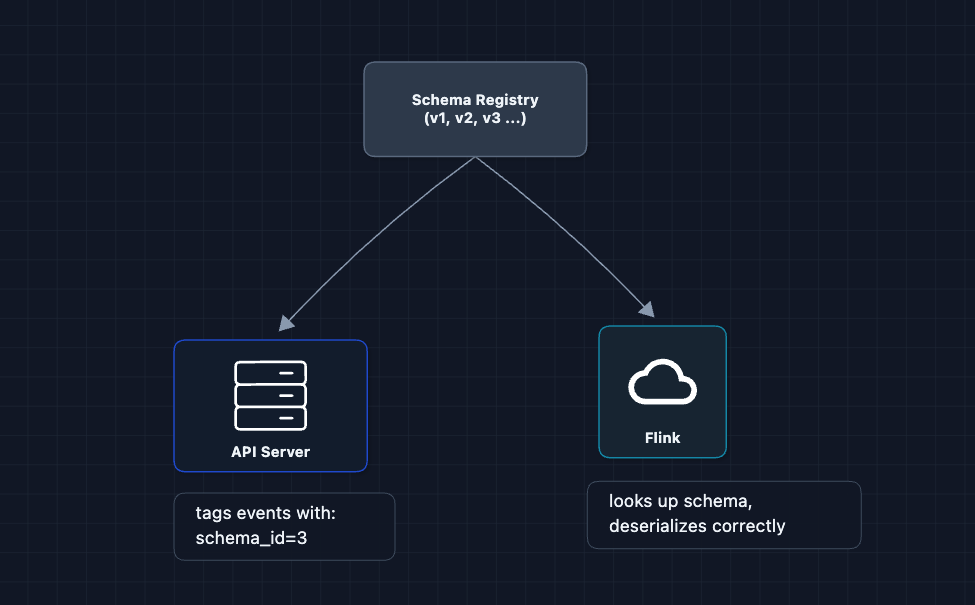
Best practice: Only add new optional fields with defaults. Never rename or delete fields (use deprecation instead).
What to Expect?
That was a lot! Here's what you should focus on at each level.
Mid-level
- Breadth over Depth (80/20): Focus on connecting the main components. It's okay to treat Flink as a black box.
- Expect Basic Probing: The interviewer will check if you understand why each component exists. "Why can't we just query the raw events?" "Why Kafka instead of writing directly to the database?"
- Assisted Driving: You lead the initial design, but the interviewer will likely guide you toward scaling issues or edge cases.
- The Bar: Successfully design the basic pipeline (Diagram 5). Understand the difference between event storage and metric storage. Know why pre-aggregation is needed.
Senior
- Balanced Breadth & Depth (60/40): Go deeper into areas you've worked with. Explain how stream processing windows work, why columnar storage is faster for analytics, or how you'd handle late events.
- Proactive Problem-Solving: Identify bottlenecks before prompted. "100K events/sec is a lot so we'll need to partition Kafka and parallelize Flink workers."
- Articulate Trade-offs: Explain why you'd accept some data loss for lower latency. Discuss exactly-once vs at-least-once semantics. Compare ClickHouse vs TimescaleDB vs Druid.
- The Bar: Complete the full system and proactively dive into 2-3 deep dives: late event handling, scaling the pipeline, or query optimization with rollups.
Staff
- Depth over Breadth (40/60): Breeze through the HLD quickly (~15 min) since the interviewer assumes you know the basics. Spend time on the interesting parts.
- Experience-Backed Decisions: Draw from real experience. "We used Flink because Spark Streaming's micro-batch latency was too high for our 10-second freshness requirement."
- Full Proactivity: You drive the entire conversation. Anticipate problems: combinatorial explosion, schema evolution, cost optimization.
- The Bar: Address all deep dives unprompted. Discuss operational concerns: monitoring, backpressure handling, replay from Kafka on failures, data quality validation.
Do a mock interview of this question with AI & pass your real interview. Good luck! 📊